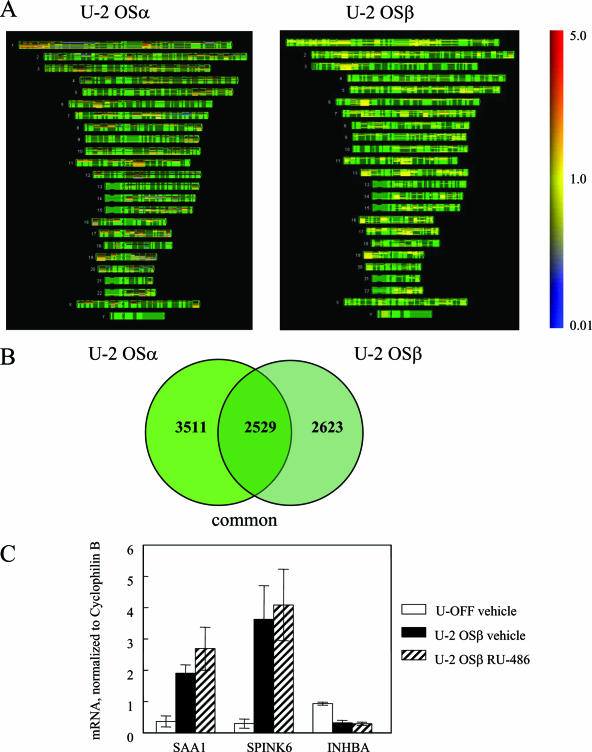
FIG. 8.
Comparison of gene regulation between hGRα and hGRβ. (A) Microarray analysis was performed on RNA from three biological replicates of U-OFF and U-2 OSα cells. Genes that were significantly different at P < 0.001 were identified and combined into one list. This gene list was compared to the combined gene list of the hGRβ-expressing cells (U-OFF versus U-2 OSβ) using human chromosome mapping. These maps show the physical positions of the genes with known loci. The structure of each chromosome is depicted in green with induced genes in red and repressed genes in blue. The color bar on the right shows the expression level of these genes ranging from 5.0 (highly induced) to 0.01 (highly repressed). (B) The Venn diagram illustrates the genes that are commonly regulated by both hGRα and hGRβ. (C) Quantitative RT-PCR was performed using the 7900HT sequence detection system using predesigned primer/probe sets for SAA1, SPINK6, and INHBA and a custom primer/probe for cyclophilin B available from Applied Biosystems. Each primer/probe set was analyzed in triplicate and with at least three different sets of RNA isolated from U-OFF cells, U-2 OSβ vehicle-treated cells, and U-2 OSβ RU-486-treated cells and normalized to cyclophilin B.

