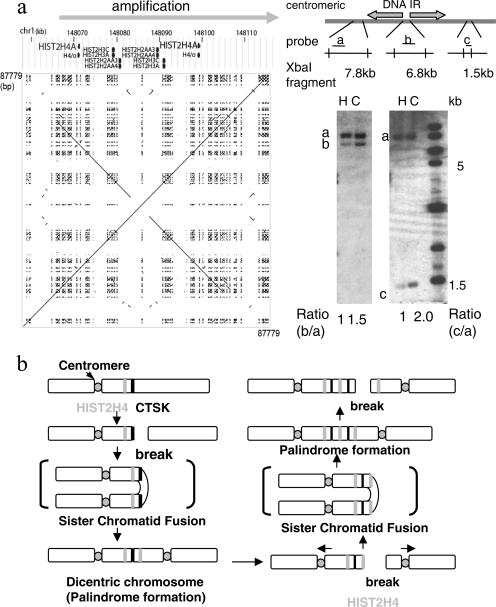
FIG. 5.
A naturally existing IR marks the centromeric border of a palindromic amplification. a. Schematic drawing and a dot plot of the 87.8-kb region at 1q21, covering HIST2H4, shows a 27-kb, naturally existing IR. A dot plot for the DNA sequence in this region (chromosome 1, 148,043,413 to 148,131,191) is shown. Southern analysis for XbaI-digested DNA of human foreskin fibroblast (H) and Colo320DM (C) cells indicated that the region centromeric to this IR (probe a for a 7.8-kb XbaI fragment) was not amplified. In contrast, the regions within (probe b for a 6.8-kb fragment) and telomeric to (probe c for a 1.5-kb fragment) the IR were amplified. Note the different degree of amplification between the nonpalindromic spacer (probe b) and telomeric region (probe c). The DNA sequence was obtained from the UCSC genome browser (http://genome.ucsc.edu/), and the dot plot was drawn using the Pipmaker (http://pipmaker.bx.psu.edu/pipmaker/). b. A model for the initiation of regional amplification at 1q21 by the BFB cycle. An initial break at the CTSK gene (black bar) led to palindrome formation and the dicentric chromosome. Subsequent BFB cycles likely resulted in another chromosome break near the 27-kb IR at the HIST2H4 locus (gray bar), generating a large DNA palindrome with the IR at the center for this regional amplification. In both cases, the centers of the palindrome set the boundary of the amplified region.

