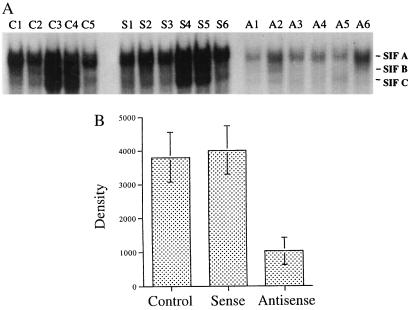
Figure 4.
Decreased Stat3 activation in tumors treated with Stat3 antisense gene therapy. (A) EMSA analysis of representative SCCHN xenografts after treatment with Stat3 antisense DNA plus liposomes (A1–6) compared with Stat3 sense DNA plus liposomes (S1–6) or liposomes alone (C1–5). (B) Cumulative results demonstrating decreased constitutive Stat3 activation levels (SIF-A band) in SCCHN tumors treated with Stat3 antisense gene therapy compared with the corresponding sense construct plus liposomes (P = 0.001) or liposomes alone (P = 0.001).

