
Figure 1.
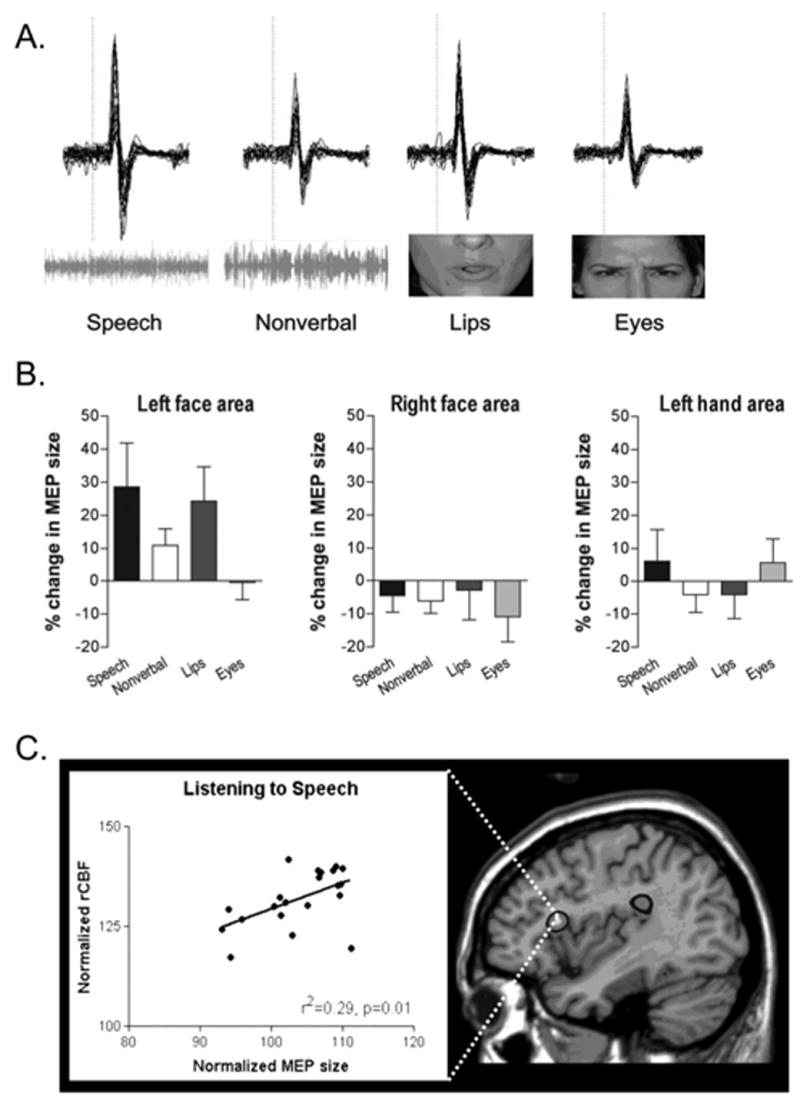
Motor excitability during speech perception. A) Data from stimulation of the left primary motor face area in a single subject when listening to speech, listening to non-verbal sounds, viewing speech, and viewing eye movements. EMG recordings from individual trials are superimposed and the dotted line indicates the time of stimulation. The horizontal bar represents 10msec and the vertical bar 0.5mV. B) Average MEP sizes for the same four stimulus conditions with stimulation to the left face area, right face area, and hand area of motor cortex. The x-axis through the 0% level represents the mean MEP size in the control condition and error bars represent standard error of the mean. Panel A) & B) are modified and reprinted from Neuropsychologia, 41, Watkins, K. W., Strafella, A. P. and Paus, T. “Seeing and hearing speech excites the motor system involved in speech production”, pp. 990–992, Copyright (2003), with permission from Elsevier. C) The relation between regional cerebral blood flow in Broca’s area and the size of the MEP evoked by single pulse TMS over the mouth region of primary motor cortex (left panel). On the right, an activation map showing the anatomical location of the significant positive relationship illustrated in the graph. Reprinted from Journal of Cognitive Neuroscience, 16(6), Watkins, K. W. and Paus, T. “Modulation of motor excitability during speech perception: The role of Broca’s area”, pp. 990–992, Copyright (2004), with permission from MIT Press.