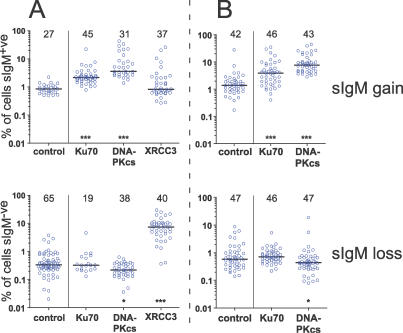
Figure 1. Surface Ig Reversion of DT40 Clones.
Accumulation (top) of sIg+ve cells in sIg−ve DT40 clones, or (bottom) of sIg−ve cells in sIg+ve DT40 clones after (A) 50 d of culture, or (B) 24 d of culture in two independent experiments (A or B) is depicted. The protein missing from each cell line is indicated. Control cells were (top) sIg−ve DT40-CL18 cells, or (bottom) sIg+ve DT40-CL18 cells. Each circle represents the frequency of sIg-reverted cells (on a log scale) detected in each clone by FACS after the culture period. The bar indicates the median reversion frequency. The numbers above each dataset give the number of clones analyzed. Asterisks indicate significant difference of the median reversion frequency from the control population: * p < 0.05, *** p < 0.001. Note: lack of surface Ig-expression in the XRCC3−/− founder clones was due to Ig V(D)J point mutations and not due to the canonical CL18 frame shift carried by the control, Ku70−/−, and DNA-PKcs−/−/− clones (unpublished data). Thus, the reduced rate of Ig V gene conversion known to exist in these cells [43,45] did not significantly reduce their rate of surface Ig gain.

