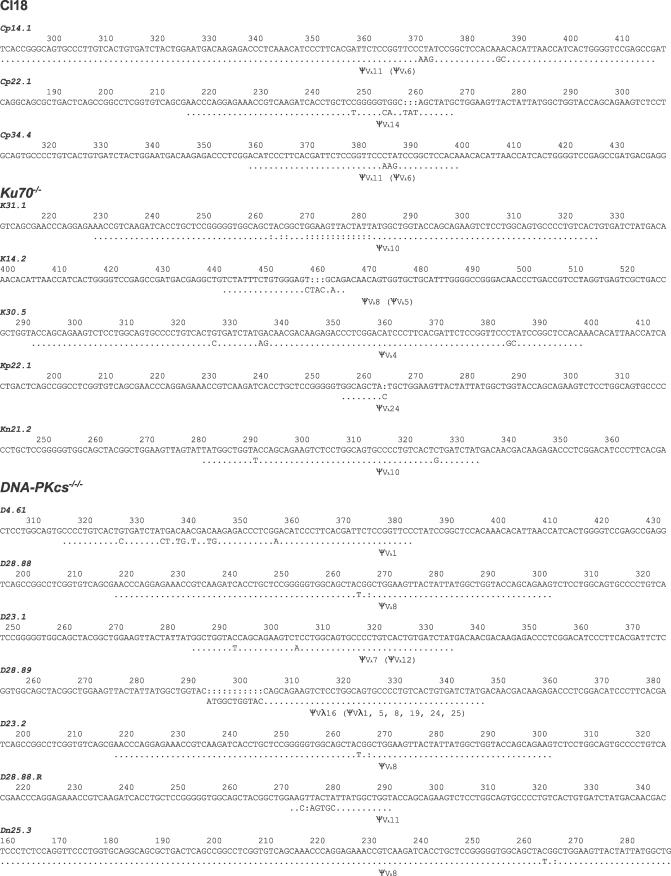
Figure 2. Gene Conversions Detected in CL18, DNA-PKcs−/−/−, and Ku70−/− Cell Lines.
The consensus sequence for each clone is shown at the top and the mutated sequence carrying a gene conversion underneath. Dots indicate identity to the clone's starting (consensus) sequence and indicate the maximum extent of sequence that could have undergone gene conversion. The ΨVλ gene with the longest stretch of identity to the mutated sequence is indicated as the gene conversion donor, with other possible donors listed in parentheses. (The identity in clone Cp14.1 with the “best” donor ΨV gene extends 5′ to that shown in the figure. Similarly, identity in clone Dp25.3 extends 3′ to that shown in the figure.) Colons indicate the insertion of a gap to maintain sequence alignment. Numbering indicates the sequence position of each gene conversion, with the translation start as base 1. Note: The same gene conversion with ΨVλ occurred independently in two DNA-PKcs−/−/−clones.

