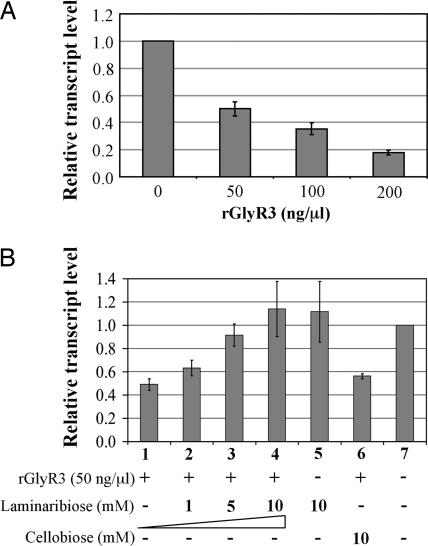
Fig. 7.
Laminaribiose induction of celC by inactivating GlyR3 as revealed by in vitro transcription assay. (A) Relative transcript level determined by quantitative RT-PCR in the presence of various amounts of rGlyR3. (B) Relative transcript level in the presence of rGlyR3 and cellobiose or various amounts of laminaribiose. The data represent the averages of the results from triplicate experiments. Vertical bars represent standard deviations.

