Fig. 3.
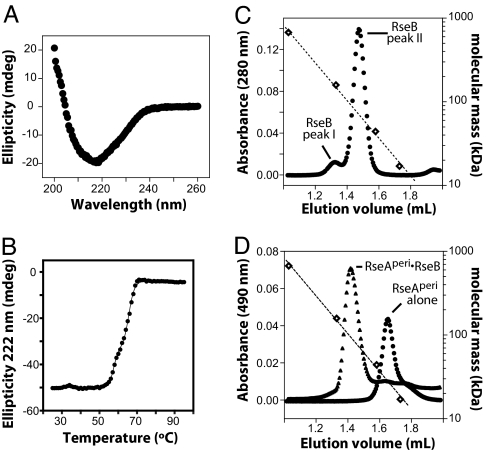
Characterization of RseB and its complex with RseA. (A) CD spectrum of 1 μM RseB at 25°C in 0.007× cleavage buffer. (B) Thermal unfolding of 3 μM RseB in 0.02× cleavage buffer was assayed by using changes in CD ellipticity. The solid line is a fit for a three-state denaturation model. (C) Gel filtration of RseB on Superdex 200 (Amersham Biosciences) at 4°C in cleavage buffer. Open diamonds mark the elution positions of molecular-weight standards. The dotted line is an exponential fit of molecular mass versus elution volume. The relative proportions of peak-I and peak-II RseB varied in different preparations. In the chromatogram shown, RseB was urea-denatured and refolded immediately before chromatography. (D) Gel filtration (same column and conditions as C) of fl-RseAperi (circles) or fl-RseAperi with excess RseB (triangles).

