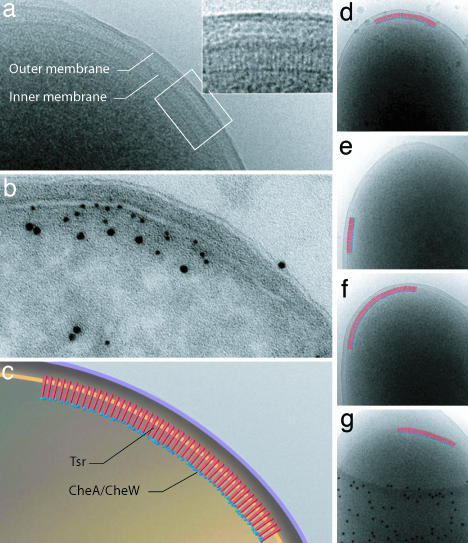
Fig. 1.
Visualization and identification of chemoreceptor arrays. (a) Low-dose cryo-projection image of the polar region in a wild-type E. coli cell, with the chemoreceptor array shown in greater detail in Inset. (b) Immunolabeling of cryo-sections from the same culture shown in a with anti-Tsr (5 nm gold) and anti-CheA (10 nm gold) antisera. (c) Schematic representation of the polar region of wild-type E. coli cells illustrating the assembly and orientation of the chemotaxis receptor array, based on a and b. (d–g) A selection of projection images demonstrating variability in size and location of chemoreceptor arrays within a single population of cells from the same EM specimen.

