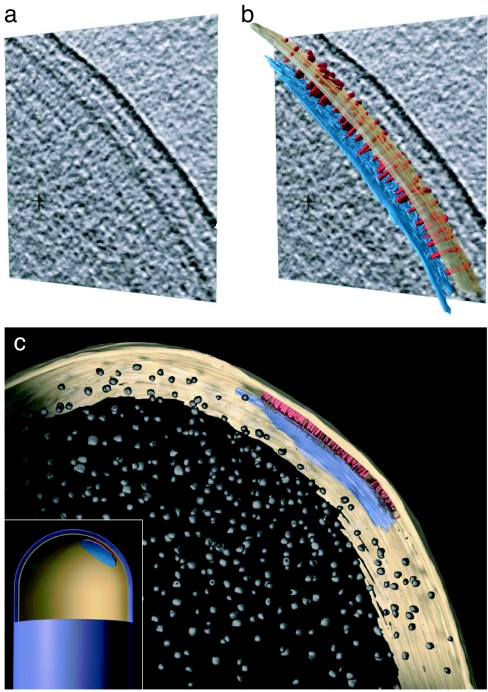
Fig. 2.
3D architecture of chemoreceptor arrays. (a and b) Cryo-tomography of intact wild-type E. coli highlighting the polar receptor array as seen in a single 5-nm tomographic slice (a) and as a segmented 3D representation of the chemoreceptor array (b). Densities corresponding to the inner membrane and CheA/CheW were manually segmented from a 279-slice cryo-tomogram by using the Amira visualization suite (TGS, San Diego, CA). For the sake of clarity, only a random subset of the striated densities have been segmented. Also shown is an expanded view of a manually segmented 3D representation (c) and a schematic representation of the chemoreceptor array displaying its position relative to the pole of the cell and to putative ribosomes in the cytoplasm (Inset). CheA/CheW and chemoreceptors are colored in blue and red, respectively, with the inner membrane in yellow and putative ribosomes in gray.

