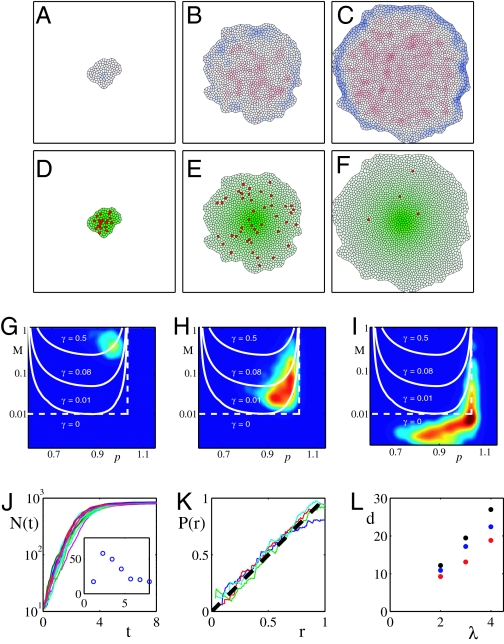
Fig. 4.
Numerical simulation of the mechanical feedback model of disk size determination. (A–C) Snapshots of the simulated growth at different times with A corresponding to the start of the simulation, B the intermediate time, and C close to cessation of growth. Color code indicates layer deformation with red corresponding to lateral compression (ξ − 1 > 0) and blue corresponding to tension (ξ − 1 > 0). (D–F) Shown (green) is the level of morphogen M(r) peaked at its source cell. Cells that are about to divide are marked red (this is intended to emulate BrdU staining of mitotic cells). Note that cell proliferation is approximately uniform throughout the disk as is the case for in vivo observations (61, 62). This uniformization of growth is a result of the mechanical feedback mediated by the build-up of compression (as seen in A–C), which compensates for the excess of morphogen in the central region. Shortly after the disk expands beyond the range where morphogen is above threshold, the build-up of stress arrests growth throughout the disk (F). (G–I) Shown is the distribution of cells in the (M, ξ) parameter plane at three different times corresponding to A–C). Also shown (white) are the lines of constant rate of growth. Note that cells cluster along the lines of constant growth rate, which decreases with time and is close to zero in I, which corresponds to growth arrest. (J) Total number of cells as a function of time for 20 different runs of simulated disk growth (as shown in A–C). Note that rms fluctuations are significant early during growth but are reduced by the time of growth arrest as shown in G Inset. (K) Probability of cell division at distance r from the morphogen source. Linear dependence on r corresponds to uniform growth. Different traces correspond to different times with blue just before growth arrest. The uniformity of growth is a consequence of the mechanical feedback used in the simulation. (L) Disk size as a function of growth parameters. Average final diameter of the disk versus λ, the characteristic length scale of morphogen, for different values of the morphogen level, m, and the strength of mechanical feedback, q. Blue corresponds to the (m, q) values (see Methods) used in the simulation in A–F); black corresponds to “overexpressed” morphogen (2m, q), which leads to larger discs; red corresponds to increased feedback (m, 2q), which decreases disk size. Note that disk size scales with the morphogen length scale λ.

