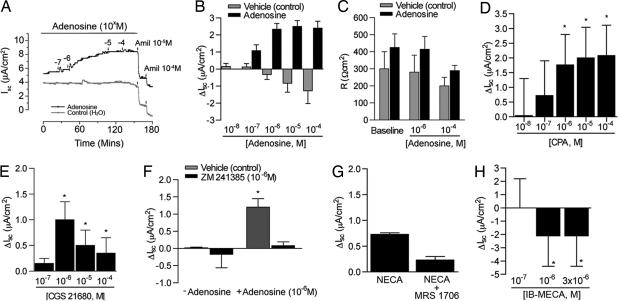
Fig. 3.
Electrophysiologic studies in rat AT2 cell monolayers. (A) Typical tracing of short circuit current (Isc) before and after addition of adenosine and amiloride. (B) Change in short circuit current (ΔIsc) across high-resistance monolayers of rat AT2 cells after 4 d in culture in the presence or absence of adenosine. Change is calculated as adenosine-induced current − baseline current measured in the presence of vehicle (water). ∗, P < 0.009 vs. baseline current. (C) Monolayer resistance of adenosine- or vehicle (control)-treated AT2 cells. Baseline values for all Isc measurements were obtained after stabilization of Isc and before addition of adenosine or vehicle. (D) Change in short circuit current (ΔIsc) across monolayers of rat AT2 cells treated with the doses shown of the A1R agonist CPA. ∗, P < 0.01 vs. control (n = 3). (E) ΔIsc produced by AT2 cells treated with the doses shown of the A2aR agonist CGS 21680. ∗, P < 0.04 vs. baseline (n = 3). (F)(ΔIsc produced by rat AT2 cells concomitantly treated with (adenosine, 10−6 M) and the A2aR antagonist ZM 241385 (10−6 M). ∗, P < 0.01 vs. vehicle (water)-treated control (n = 3). (G) ΔIsc in rat AT2 cells treated with the nonspecific type 2 receptor agonist NECA (3 × 10⁻⁶ M) with and without the A2bR-specific antagonist MRS 1706 (10−5 M). n = 3 filters. (H) ΔIsc from baseline in rat AT2 cells treated with the A3R-specific agonist MECA at the doses shown. n = 3 filters. ∗, P < 0.02 vs. baseline Isc.

