Fig. 1.
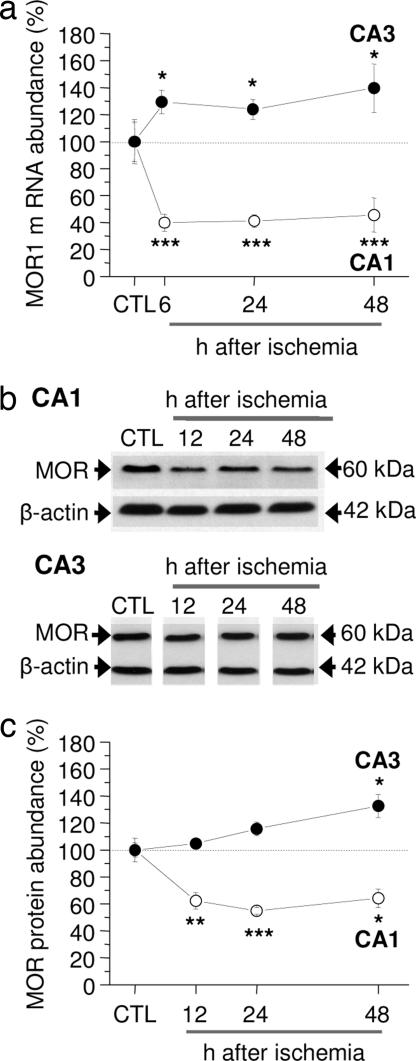
Global ischemia decreases MOR-1 mRNA and protein expression in CA1. (a) Real-time PCR of RNA samples from the CA1 and CA3 of control and experimental animals at 6, 24, and 48 h after ischemia. Bars represent relative mRNA quantity measured by the Ct values ± SEMs, where Ct is the number of cycles needed for detection of the fluorescence signal; significance was assessed by using the REST software with which transcript differences are tested for significance by a pairwise fixed reallocation–randomization test (55). ∗, P < 0.05; ∗∗, P < 0.01; ∗∗∗, P < 0.001. (b and c) Representative Western blots probed with anti-MOR antibody (b) and relative MOR abundance in samples from the CA1 and CA3 at 48 h after sham operation (control) or at 12, 24, and 48 h after ischemia (c). Values are expressed as the ratio of band densities for experimental samples to band density of the corresponding control sample after correction for loading. Bars represent mean ± SEMs. ∗, P < 0.05; ∗∗, P < 0.01; ∗∗∗, P < 0.001 (Student's unpaired t test).

