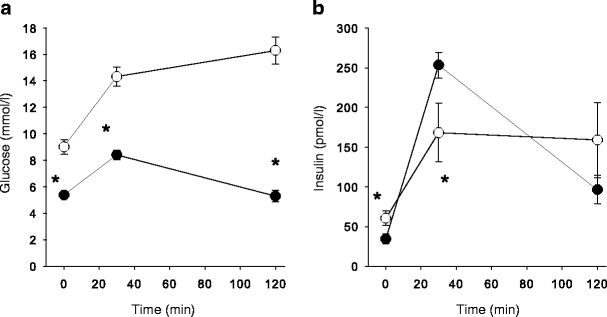
Fig. 1.

Glucose (a) and insulin (b) concentrations in venous plasma before (t = 0 min) and during an OGTT. The patients with type 2 diabetes had higher fasting glucose levels and were severely insulin resistant compared with healthy control subjects (*p < 0.05). Black and white symbols represent healthy control subjects and patients with type 2 diabetes, respectively
