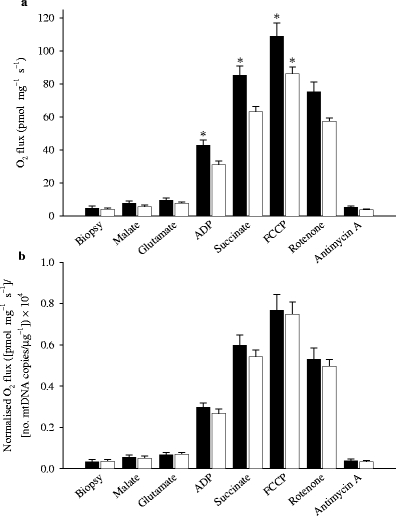
Fig. 2.

O2 flux in permeabilised skeletal muscle fibres from patients with type 2 diabetes and healthy control subjects. Data are shown as O2 flux per mg of tissue (a) and further normalised to the number of copies of mtDNA per μg of tissue ×10,000 (b). When data are expressed relative to mtDNA, any difference between the groups disappears. Data are means±SEM (*p < 0.05). Black and white bars represent healthy control subjects and patients with type 2 diabetes, respectively
