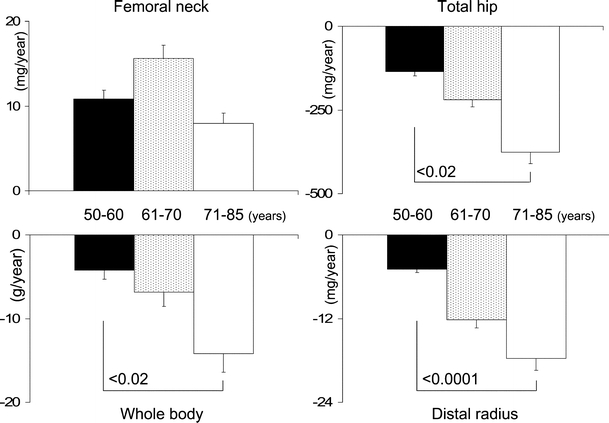
Fig. 3.

Comparison of the absolute values of net bone loss [(change in bone mineral content (BMC)] according to age group (black bars 50–60 years, pointed bars 61–70 years, white bars >70 years old). The slopes are different from 0 (p < 0.005–0.0001) for all regions of interest (ROIs) and for all age groups
