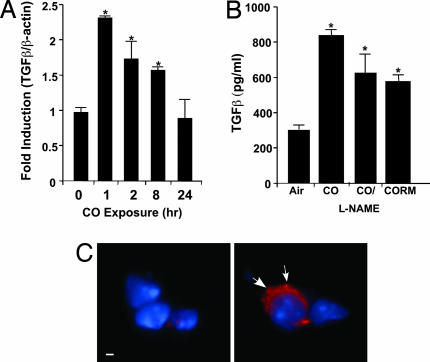
Fig. 3.
Induction of TGF-β expression after exogenous administration of CO. (A) Kinetics of TGF-β mRNA expression in mxz by PCR analyses. Results were normalized to the β-actin (∗, P < 0.001). (B) Secretion of TGF-β in response to CO gas (± N-nitro-l-arginine methyl ester) or CORM in mφ (∗, P < 0.002). Shown is the mean ± SD of six wells from three independent experiments. (C) Immunofluorescent localization of TGF-β in mouse lung ± CO. Wide-field, 3D reconstruction of lung sections stained for TGF-β shows primarily localization in alveolar mφs. Images are representative of 10 sections from three or four mice per group. (Left) Air. (Right) CO. Blue are nuclei and red is intracellular TGF-β expression denoted by arrows. (Scale bar: 1 μm.)

