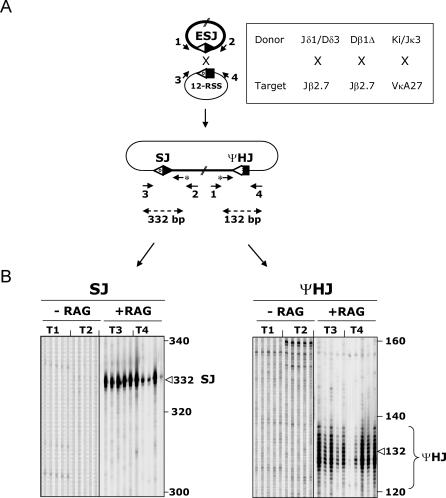
Figure 2. Ex Vivo trans-V(D)J Recombination Assay.
(A) Schematic representation of trans-V(D)J recombination between an ESJ (donor) and a 12-RSS (target). The expected breakpoints (one SJ and one ΨHJ) are shown. The various donor/target combinations assayed are boxed. PCR primers are depicted by arrows. Nested IR800-labeled PE primers are indicated by an asterisk.
(B) Typical example of PCR/PE assays obtained from the (Dβ1Δ) ESJ × Jβ2.7 12-RSS combination. The expected sizes of the PE products are indicated. As the resolution of the PE assay is to the base, ΨHJ patterns typically show multiple bands (corresponding to the spectra of nucleotide addition and deletion), while SJ patterns are typically centered on a major band (corresponding to no or limited nucleotide processing). PE assays shown were performed on 0.75 μl PCR. Five independent PCRs from two independent transfections performed with (T3–T4) or without RAG-1/2 (T1–T2) are shown for each junction.

