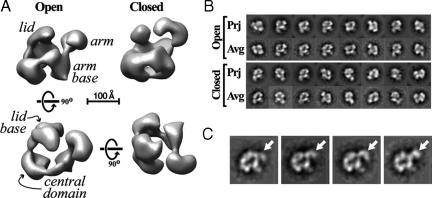
Fig. 2.
RSC conformational variability. (A) Reconstructions of two conformers of RSC. The initial models were obtained by using the Orthogonal Tilt Reconstruction method and then refined by projection-matching against 0° data. The names of the main features of the reconstructions are indicated in italics. The “open” and “closed” conformations differ mainly in the position of the arm (at the right of the structures shown in the top row). The bottom row shows the “top” and “back” views of the open conformer. A scale bar corresponding to 100 Å is shown. (B) Comparison of reprojections (“Prj”) of the structures shown in A with the best-matching reference-free class averages (“Avg”). (C) Four selected experimental class averages for RSC showing a variety of positions occupied by the arm (arrows).

