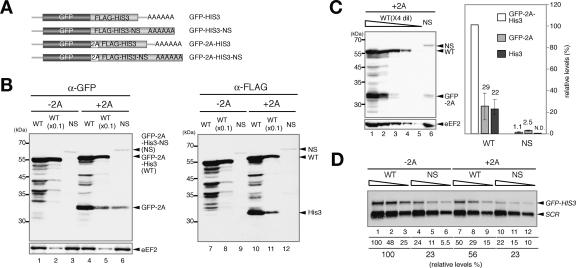
Figure 1.
Multiple steps are involved in the repression of nonstop gene expression. (A) Schematic drawing of the construction of fusion genes. The boxes indicate the ORFs and the stretch of A indicates a poly(A) tail on reporter mRNAs. (B) Translation repression and post-translational regulation are involved in the reduced expression of nonstop mRNA. W303 cells were transformed with pGPDp-GFP-HIS3 (WT, −2A) or pGPDp-GFP-HIS3-NS (NS, −2A) or pGPDp-GFP-2A-HIS3 (WT, +2A) or pGPDp-GFP-2A-HIS3-NS (NS, +2A). Cells were grown in SC-Ura, and samples were prepared as described previously (Inada and Aiba 2005). The levels of proteins were analyzed by Western blotting with anti-GFP antibody (left panel) or anti-Flag antibody (right panel). The samples were applied after 10-fold dilution when indicated. (C) The quantification of GFP-2A and GFP-2A-His3 products derived from pGPDp-GFP-2A-HIS3 (WT) or pGPDp-GFP-2A-HIS3-NS (NS) genes. (Left) Protein samples prepared from cells harboring indicated plasmids were diluted fourfold and analyzed by Western blotting with anti-GFP antibody. (Right) The relative levels of each product normalized to the level of GFP-2A-His3 as 100% are shown as the mean values of three independent experiments with standard deviations. (D) The insertion of 2A sequence has little effect on the nonstop mRNA level. RNA samples prepared from cells shown in B were diluted twofold (5–1.25 μg) and analyzed by Northern blotting with GFP and SCR probes. (Lane 1) Numbers immediately below the figure represent the level of mRNA normalized to the level of GFP-HIS3 mRNA as 100%. The numbers are shown as the mean values of three independent experiments.

