Figure 4.
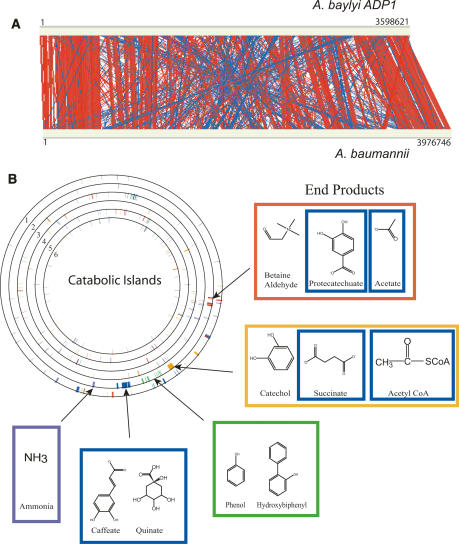
Synteny map. (A) The genomes of A. baylyi (top) and A. baumannii (bottom) were compared by WebACT (http://www.webact.org/WebACT/home) and visualized by ACT (Carver et al. 2005). Red indicates similar genomic organization, whereas blue indicates inversions. (B) The genomes of six bacteria were compared for the distribution of key catabolic enzymes (from the outermost to the innermost ring): A. baumannii, A. baylyi, P. aeruginosa, N. meningitidis, E. coli K12, and B. subtilis. The island clusters were defined by Barbe et al. (2004) based on their location in the A. baylyi genome and are colored gray (−), red (I), orange (II), green (III), blue (IV), and purple (V). The end products of the pathways encoded within each of the catabolic islands are depicted. The boxes surrounding the end products are colored to match the islands from which they were derived. The circles were drawn using the program GenomeViz (http://www.uniklinikum-giessen.de/genome/genomeviz/intro.html).

