Figure 5.
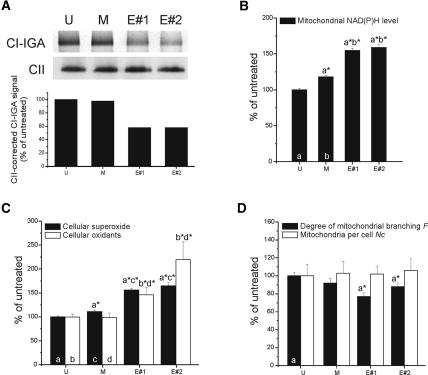
Ecsit knockdown using RNAi affects mitochondrial and cellular physiology. (A) Complex I in-gel activity (CI-IGA) and complex II (CII) expression following native electrophoresis in untreated (U), mock-treated (M), and two Ecsit RNAi knockdowns (E#1 and E#2). The bottom panel depicts the complex I in-gel activity (CI-IGA) signals corrected for complex II (CII) expression (expressed as percentage of the value in untreated cells) determined by integrated optical density analysis. (B) NAD(P)H levels in untreated (U), mock-treated (M), and siRNA-treated (E#1 and E#2) cells. Bars represent the average of 262 (U), 293 (M), 234 (E#1), and 180 (E#2) cells. (C) Cellular superoxide (filled bars) and oxidant levels (open bars) in untreated (U), mock-treated (M), and siRNA-treated (E#1 and E#2) cells. Bars represent the average of 294 (U), 284 (M), 335 (E#1), and 93 (E#2) cells for superoxide levels, and 47 (U), 33 (M), 41 (E#1), and 25 (E#2) cells for oxidant levels. (D) Degree of mitochondrial branching (F, black bars) and number of mitochondria per cell (Nc, open bars) in untreated (U), mock-treated (M), and siRNA-treated (E#1 and E#2) cells. Bars represent the average of 50 (U), 56 (M), 70 (E#1), and 50 (E#2) cells. In B–D, letters (a, b, c, and d) represent statistically significant differences with the indicated columns. Data was obtained during two independent experiments from multiple cells (N).

