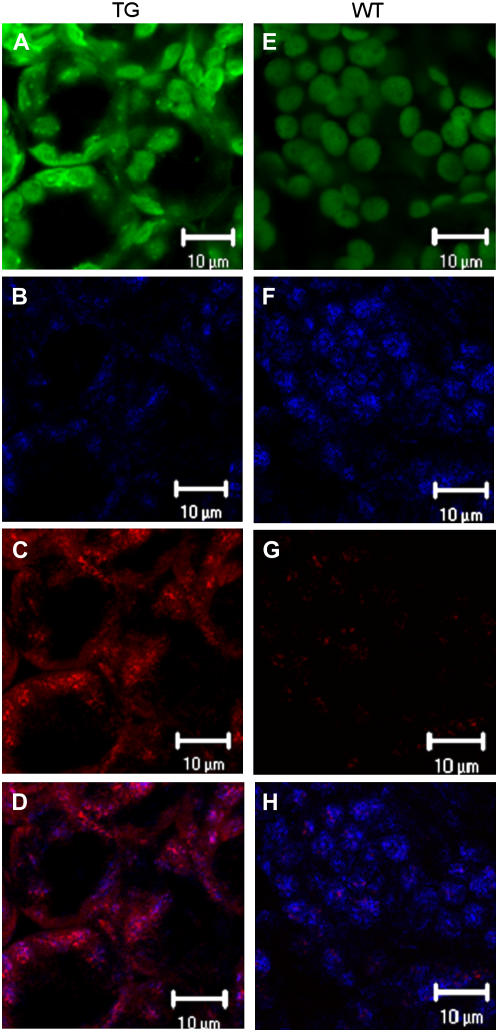
Figure 8.
Confocal microscopy of sections from the first leaf pair of 4.5-week-old transgenic (T3 generation) homozygous line 2 plants (A–D) and of wild-type plants (E–H). A and E, Autofluorescence of chloroplasts pseudocolored green. B and F, Fluorescence of FITC pseudocolored blue, indicating antibody bound to TAG lipase protein. C and G, Fluorescence of Nile Red associated with neutral lipid (pseudocolored red). D, Merged image of B and C. H, Merged image of F and G. Bar = 10 μm.

