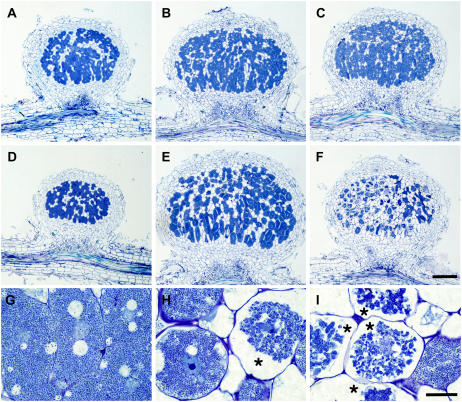
Figure 3.
Light micrographs of nodule structure of wild-type and ign1 plants. A to F, Comparisons of nodule structures of wild type (A–C) and ign1 mutant (D–F) at 14 (A and D), 17 (B and E), and 21 dpi (C and F). Bar = 200 μm. G to I, Infected cells of 17 dpi wild-type nodule (G) and of ign1 nodules at 17 (H) and 21 dpi (I). Disintegrated infected cells of ign1 nodules are indicated by asterisks. Bar = 20 μm.

