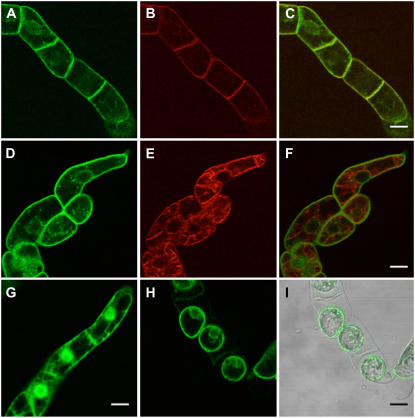
Figure 8.
Confocal laser scanning micrographs of BY2 cells expressing GFP-IGN1 fusion protein. A to F, BY2 cells 20 min (A–C) and 10 h (D–F) after labeling with FM4-64. Green fluorescence from GFP-IGN1 (A and D), red fluorescence from FM4-64 (B and E), and the merged images (C and F) are shown. G, Control image from GFP only. H, GFP-IGN1 fluorescence after plasmolysis. I, Nomarsky image overlaid with H. Scale bars = 20 μm.

