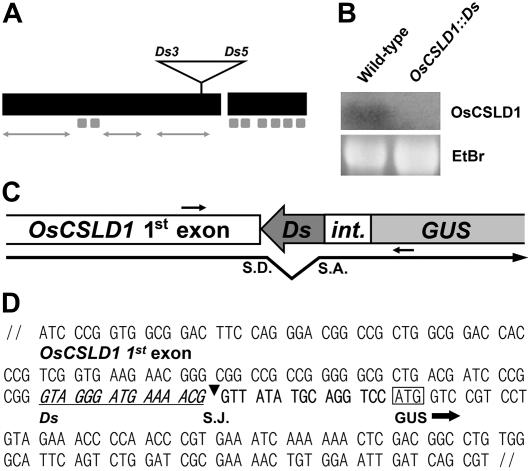
Figure 1.
Transcript analysis of OsCSLD1∷Ds. A, Genomic structure of OsCSLD1 showing the position of the trap Ds element. The open reading frame comprised two exons that were 2,676 and 708 bp in size and a short 87-bp intron. The black boxes indicate exons, while the eight small gray boxes indicate the sequences that encode membrane-spanning domains. The arrows correspond to three variable regions. B, Northern analysis of OsCSLD1 mRNA. Total RNA was extracted from the roots of wild-type and OsCSLD1∷Ds plants. The probe was from the 3′ UTR of the OsCSLD1 gene. C, Schematic depiction of the spliced junction of the OsCSLD1∷Ds fusion transcript. Shown are part of the first exon and the GUS of the trap Ds. int., A partial intron fused to the GUS coding region. The putative splicing donor (S.D.) and acceptor sites (S.A.) are indicated by the bent arrow. The primers used to clone the cDNA are indicated by the small arrows. D, The cDNA sequence of the spliced junction of the OsCSLD1∷Ds fusion transcript. The Ds sequence is underlined and S.J. indicates the splicing junction. The ATG codon in a box is the start codon of GUS.

