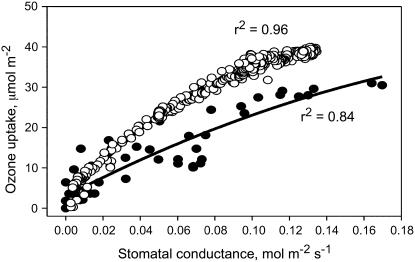
Figure 1.
Relationship between ozone uptake and stomatal conductance in leaves of holm oak (black symbols) and P. nigra (white symbols). The second-order best-fit lines (r2 = 0.84 and 0.96, respectively) were generated by the Sigmaplot 2002 software (Systat) and are not constrained through the origin.

