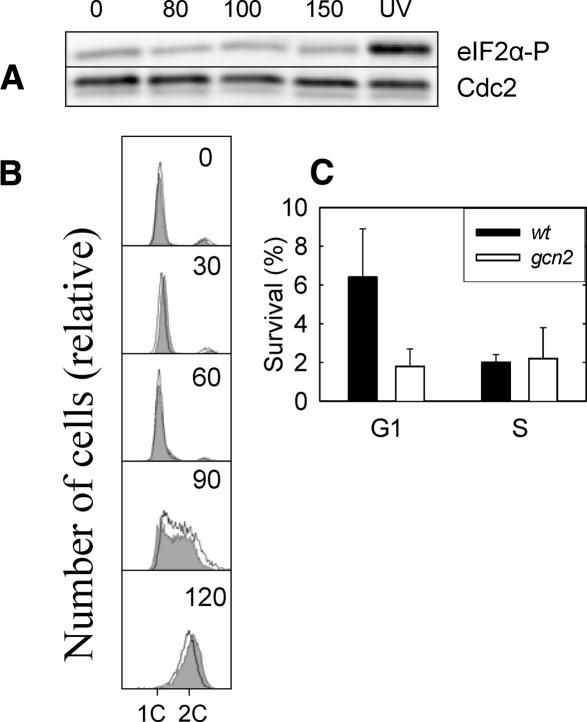
Figure 5.
Characterization of the G1 checkpoint. (A) Immunoblot of total cell extracts after different doses of ionizing radiation (Gy) was probed with antiserum against phosphorylated eIF2α (top) and Cdc2 (loading control; bottom). (B) Flow cytometry histograms of cdc10ts cells that were synchronized, exposed to 80 Gy of ionizing radiation, released into the cell cycle, and incubated for the times indicated (in minutes). Two DNA histograms are shown in each panel: one for nonirradiated control cells (filled) and one for irradiated cells (no fill). (C) Survival (with standard errors from five experiments shown) of wild-type and gcn2 mutant cells after UV irradiation in G1 or in S phase.

