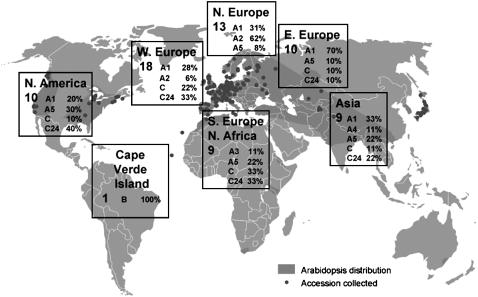
Figure 5.
Geographical Distribution of S Locus Variants.
The frequencies of different S haplotypes (designated as in Tables 1 and 2) in each of seven geographical areas are expressed as a percentage of accessions surveyed from each area (indicated by the number at the left side of each box). The map (obtained from www.natural-eu.org) shows the worldwide distribution of A. thaliana (dark shading) and the location of accessions available through seed stock centers (dots). Note that the distribution of different subtypes of the Sa class of haplotypes is consistent with independent diversification in different geographical areas. In particular, S haplotypes belonging to the A1 or A5 subtypes, which likely invaded Europe from Asia, apparently differentiated into the A2 subtype in western and northern Europe and into the A3 subtype in southern Europe.

