Figure 1.
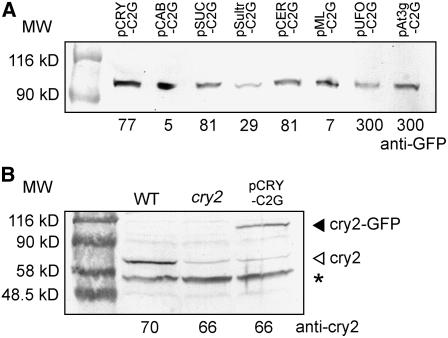
Immunoblot Detection of cry2-GFP and Endogenous cry2.
Proteins were extracted from 10-d-old seedlings grown under LD. The numbers below the panel indicate loading amounts of the proteins (μg). MW, molecular mass (kD). The lines shown are pCRY-C2G-16, pCAB-C2G-6, pSUC-C2G-2, pSultr-C2G-10, pML-C2G-6, pCER-C2G-8, pUFO-C2G-13, and pAt3g-C2G-7.
(A) Immunoblotting analysis with an anti-GFP antibody.
(B) Immunoblotting analysis with an anti-cry2 antibody. The asterisk indicates nonspecific bands.

