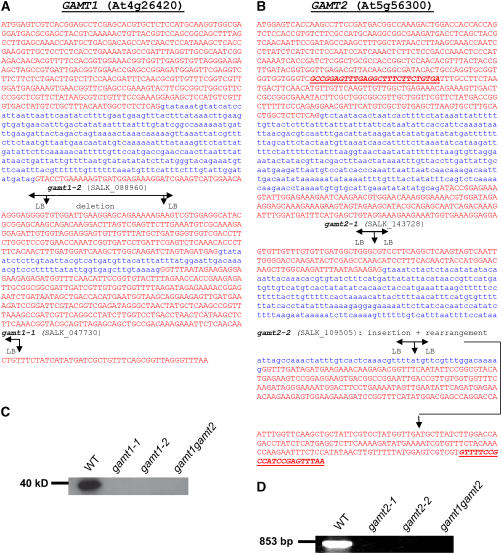
Figure 3.
Analysis of T-DNA Insertional Mutants in GAMT1 and GAMT2.
(A) The correct gene structure of GAMT1 (At4g26420) based on comparisons of full-length cDNAs with the genomic sequence. Exon sequences are shown in red, and intron sequences are shown in blue. The position of the T-DNA insertions in gamt1-1 and gamt1-2 are shown based on sequencing of the amplified border segments. In gamt1-2, a left border (LB) is present at both ends of the T-DNA insertion, and the genomic sequence in between has been deleted.
(B) The gene structure of GAMT2 (At5g56300) based on the annotation in TAIR and the comparisons of full-length cDNAs with the genomic sequence. The position of the T-DNA insertions in gamt2-1 and gamt2-2 are shown based on sequencing of the amplified border segments. In gamt2-2, the region downstream from the insertion is rearranged so that the outlined part of the third exon is missing and a segment of intron 2 plus additional unknown segments are present. The bold and underlined sequences indicate the position of the primers used in the RT-PCR experiment whose results are shown in (D).
(C) A protein gel blot using anti-GAMT1 antibodies with crude protein extracts from siliques of wild-type plants, gamt1-1, gamt1-2, and the double mutant gamt1-2 gamt2-2. The GAMT1 protein, present in the wild-type plants but not in the mutants, migrates on SDS-PAGE gels as an ∼40-kD protein.
(D) Results of RT-PCR using the oligonucleotide primers indicated in (B) and RNA extracted from siliques of wild-type plants and gamt2-1, gamt2-2, and gamt1-2 gamt2-1. The predicted product of 853 nucleotides was obtained from wild-type plants but not from mutants.

