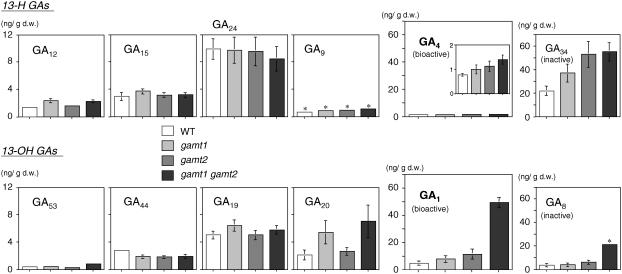
Figure 9.
GA Levels in Developing Siliques of gamt Single and Double Mutants.
Shown are endogenous levels of GAs in developing siliques of the wild type, gamt1-1 and gamt2-2 single mutants, and the gamt1-2 gamt2-2 double mutant plants. Results of respective GAs are displayed according to their order in the biosynthesis pathway (see Figure 1). Results of GA4 are also indicated in the inset with a different y axis scale to clarify the differences among the genotypes. Note that the y axis scale for precursor GAs (GA12, GA15, GA24, GA9, GA53, GA44, GA19, and GA20) is different from that for bioactive (GA4 and GA1) and deactivated (GA34 and GA8) forms. GA measurements were conducted three times using independently prepared plant extracts. Means with se (which are displayed only when they are >0.2) from triplicates are shown. Asterisks indicate that these GAs could be measured reliably only once due to comigration of impurities on the liquid chromatograph. d.w., dry weight.

