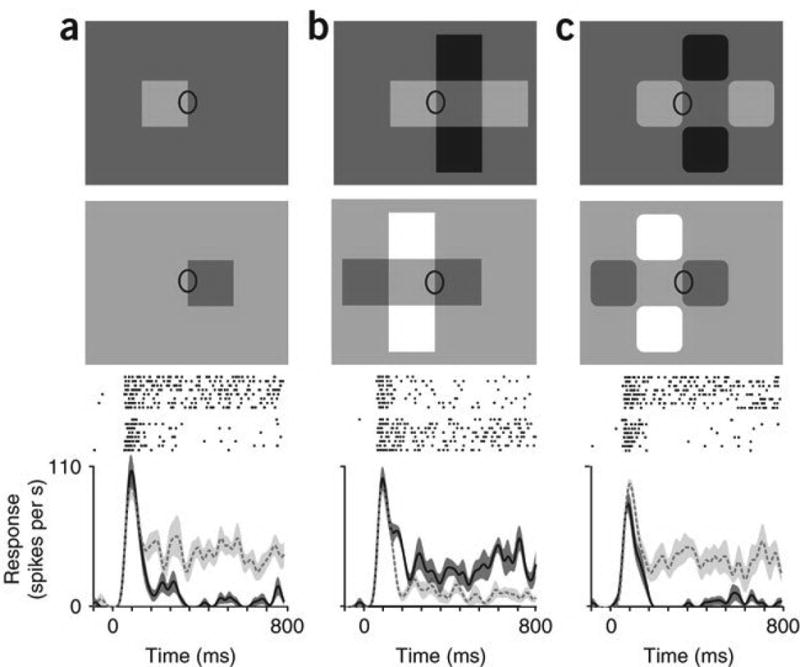
Figure 1. Neural border ownership assignment in situations of transparent overlay.

(a–c) A V2 neuron was tested with three different configurations, one of which appears as a transparent overlay of two bars (b). Each configuration was applied in two mirror-image versions with local edge contrast preserved, as illustrated in the two rows of displays (ellipse marks the location of the receptive field). Below, raster plots represent corresponding responses of the neuron. The curves show the smoothed mean firing rate; shaded region indicates ± s.e.m. Dashed line and light shading correspond to the top displays; solid line and dark shading correspond to the bottom displays. Displays with the opposite contrast polarity (not illustrated) were also tested; raster plots and curves include the responses for both polarities. Typically, the squares measured 3° on a side, with luminances of 93, 62, 32 and 2 cd m−2 for white, light gray, dark gray and black, respectively. Single neuron responses were recorded from the visual cortex of macaques during behaviorally induced fixation. See Supplementary Note.
