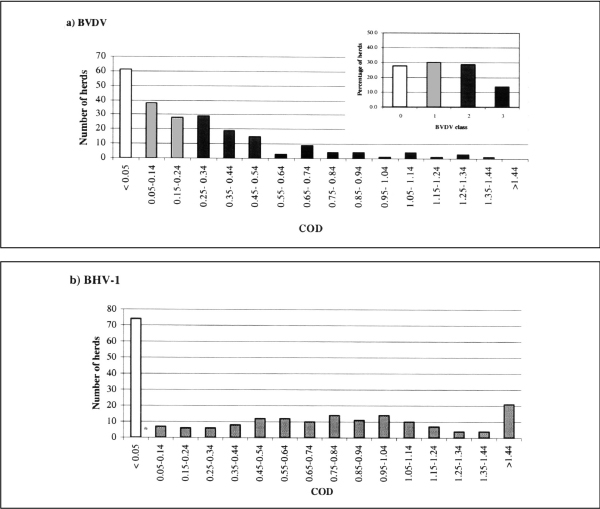
Figure 2.

Frequency distribution of bulk milk corrected optical density (COD) values from the BVDV antibody assay (a) with an inserted histogram showing the percentage of herds in each BVDV class derived from the CODs, for 220 dairy herds in Thailand. (b) The frequency distribution of bulk milk COD from the BHV-1 antibody assay.
