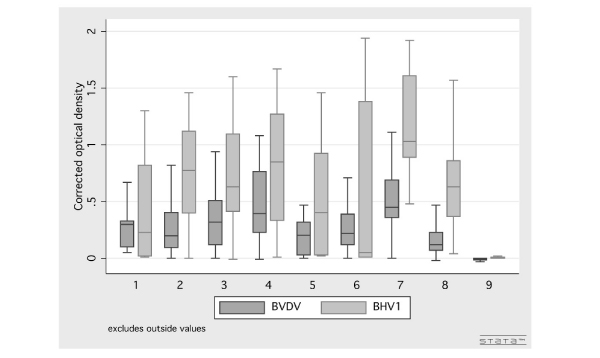
Figure 3.

Box plot showing the distribution of bulk milk corrected optical densitiy (COD) values for BVDV and BHV-1 from dairy herds in nine public milk centres in Thailand, 2000–2001. Boxes represent the first quartile (q1), median and third quartile (q3) of the COD values from each milk centre, and lower (L) and upper (U) limits are defined as: L = q1 - 1.5 × IQR and U = q3 + 1.5 × IQR, where IQR = q3 - q1.
