
Figure 2.
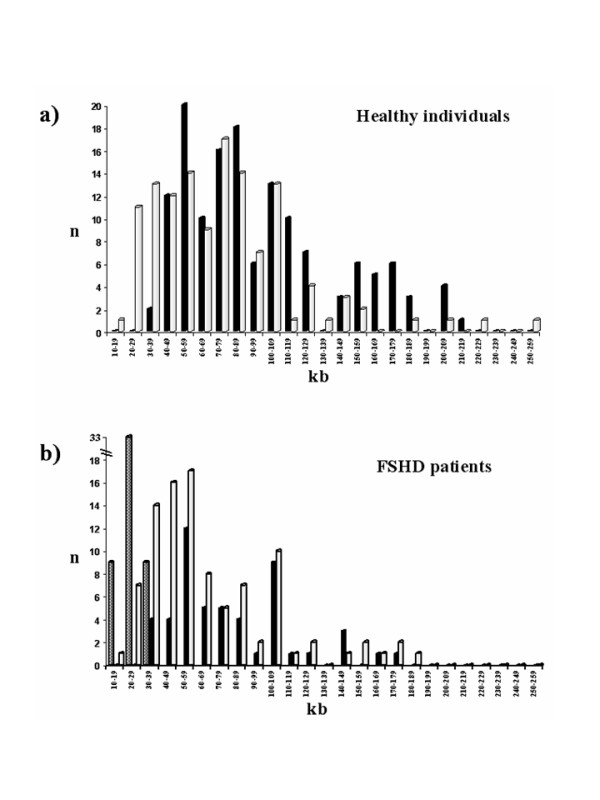
Size distribution of 4q and 10q alleles in healthy and FSHD affected subjects. The size distributions of 4q and 10q alleles detected in healthy subjects (panel a) and FSHD patients (panel b) are represented. The size of EcoRI fragments is expressed in kb, with 10 kb intervals. Black bars: 4q wild-type alleles; grey bars: disease-associated 4q alleles; white bars: 10q alleles.