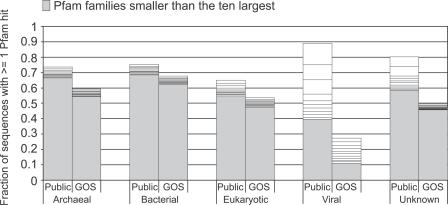
Figure 5. Coverage of GOS-100 and Public-100 by Pfam and Relative Sizes of Pfam Families by Kingdom, Sorted by Size.
The public-100 sequences are annotated using the NCBI taxonomy and the source public database annotations. GOS-100 sequences were given kingdom weights as described in Materials and Methods. For each kingdom, the fraction of sequences with ≥1 Pfam match are shown, while the ten largest Pfam families shown as discrete sections whose size is proportional to the number of matches between that family and GOS-100 or public-100 sequences. Pfam families that are smaller than the ten largest are binned together in each column's bottom section. Pfam covers public-100 better than GOS-100 in all kingdoms, with the greatest difference occurring in the viral kingdom, where 89.1% of public-100 viral sequences match a Pfam domain, while only 27.5% of GOS-100s have a sequence match.

