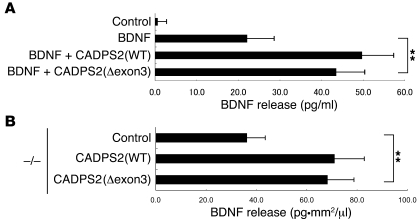
Figure 11. Functional analyses of CADPS2 exon 3.
(A) BDNF release induced by 50 mM KCl in PC12 cells transfected with CADPS2(WT) or CADPS2(Δexon3) together with a BDNF expression plasmid. Average values obtained from 4 independent experiments are shown. (B) BDNF release activity in Cadps2–/– neocortical cultures transfected with control vector, CADPS2(WT), or CADPS2(Δexon3) using the calcium phosphate method at 4 DIV was evaluated at 21 DIV by measuring the amounts of BDNF spontaneously secreted into the culture medium over the course of the previous 17 days. Activity is indicated in BDNF concentration (pg/μl) normalized to cell density (/mm2). Average values obtained from 4 independent experiments are shown. The error bars indicate SD. **P < 0.01, Student’s t test.

