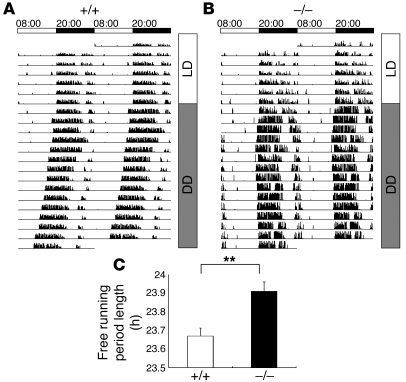
Figure 3. An abnormal sleep/wake rhythm of Cadps2–/– mice.
(A and B) Sleep/wake rhythms of locomotor activity under free wheel-running conditions. Representative activity traces of WT (A) and Cadps2–/– (B) mice for 7 days of LD cycle and 14 days of constant darkness (DD) are represented as relative deflections from the horizontal line. Actograms are double-plotted over a 48-hour period. Time is expressed in a 24-hour cycle on the top of A and B. (C) The circadian period (h) calculated by a c2 periodogram of Cadps2–/– mice (black bar; n = 9) and WT littermates (open bar; n = 8). The error bars indicate the SEM. **P < 0.01, Student’s t test.

