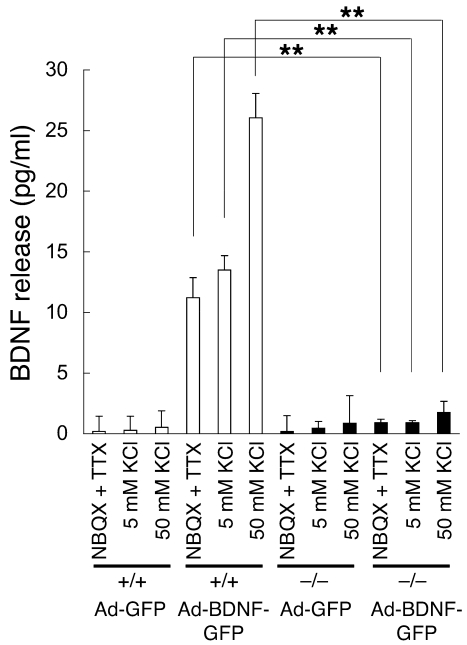
Figure 8. Decreased release of BDNF from Cadps2–/– cerebellar cultures.
WT (white bars) and Cadps2–/– (black bars) cerebellar cultures were infected with the Ad-GFP and Ad-BDNF-GFP at 5 DIV. ELISA of BDNF levels released into the conditioned media from the cultures at 7 DIV with NBQX plus TTX, 5 mM KCl, and 50 mM KCl stimulation for 15 minutes. Average values obtained from 3 independent experiments are shown. There was no significant difference in MAP2ab-positive cell density and cellular BDNF contents between the WT and Cadps2–/– cultures infected with Ad-BDNF-GFP (data not shown). The error bars indicate SD. **P < 0.01, Student’s t test.

