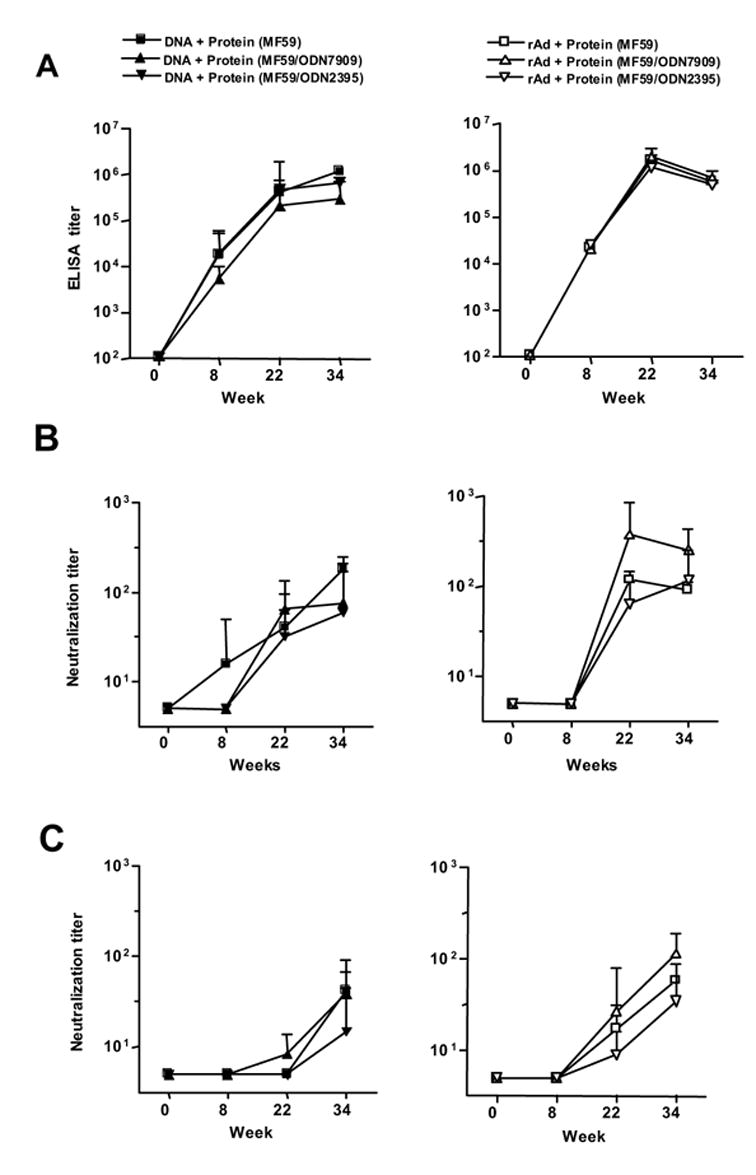
Fig 3.

Comparison of MF59 and GpG ODN adjuvants. The symbols at the top of the left and right columns describe the animal groups. (A) Anti-Env ELISA titers are shown for DNA (left panel) and rAd (right panel) immunized animals. Note that the graphs for MF59 used alone or combined with an ODN are overlapping. Also shown are Neutralization IC50 titers for viral isolate SS1196 (B) and viral isolate BaL.01 (C).. The line graphs show the geometric mean value and SEM for each time point; there were four animals in each group.
