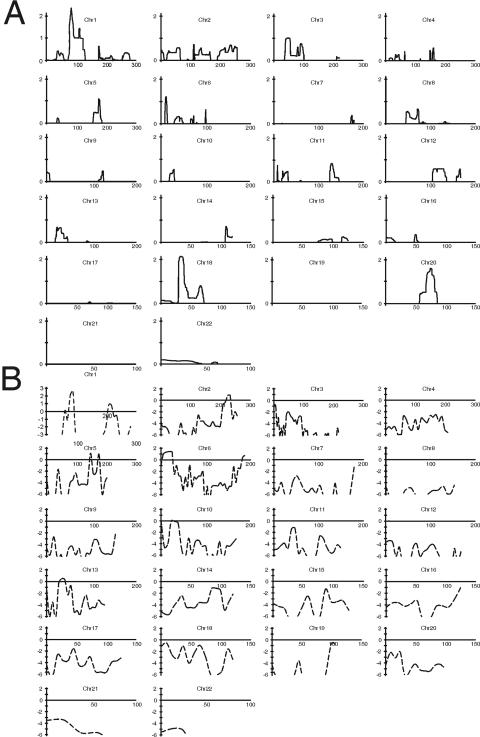
Figure 2. .
LOD score distribution across the genome. The continuous lines (A) represent the HLOD scores obtained from the SNP scan with affected-only analysis of all seven pedigrees (minimum HLOD=0). The dashed lines (B) represent the parametric LOD scores obtained from microsatellite scan in pedigree K100 alone. Values <−6 are not shown. Chr = chromosome.

