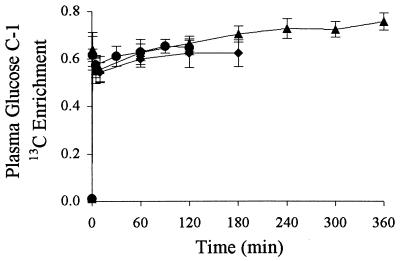
Figure 1.
Graph showing the time courses of plasma Glc C-1 fractional enrichment with 13C for group A (•), group B (⧫), and group C (▴). Each point represents the mean for the group and the error bars give ±SD. In group A, the total plasma Glc 13C fractional enrichment was taken to be twice the fractional enrichment measured at C-1 because [1,6-13C]Glc had been infused.

