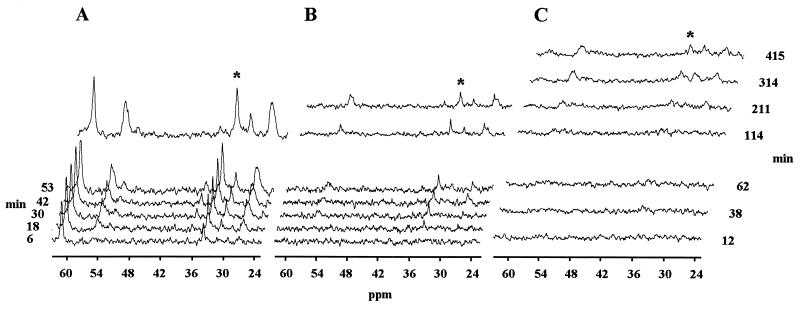
Figure 2.
Selected timepoints from sets of 1H-decoupled 13C NMR spectra of the rat brain in vivo at 7.0 T, acquired during a 13C-labeled Glc infusion (pre-infusion baseline scans subtracted). Representative spectra are shown for animals from each of the experimental groups: A, morphine sulfate; B, α-chloralose, and C, sodium pentobarbital. In group A, a [1,6-13C]Glc infusion (2h) was administered, whereas in groups B and C, a [1-13C]Glc infusion (3.5 h and 7 h, respectively) was used. The timepoints on the left of the figure refer to the first 5 spectra from groups A and B, whereas those on the right refer to the spectra from group C and the later spectra from A and B. The visible resonances are glutamate C-4 (34.3 ppm; indicated by ∗), Gln C-4 (31.6 ppm), unresolved glutamate and Gln C-3 (27.8 ppm and 27.0 ppm, respectively) and unresolved glutamate and Gln C-2 (55.5 ppm and 55.0 ppm, respectively). In addition, in the spectra from group A the C-6 resonance of Glc was present at 61.4 ppm (because of the [1, 6-13C]Glc infusion), and small peaks at 37.5 ppm and 53.1 ppm also were visible, probably arising from aspartate C-3 and C-2. The time resolution was 10 min for spectra shown from groups A and B and 20 min for spectra from group C.

