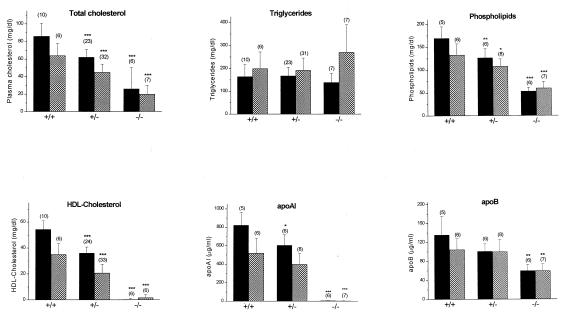
Figure 2.
Lipid analysis of +/+, +/−, and −/− male (solid columns), and female (shadowed columns) mice fed a chow diet. Bar graph represents the means ± standard deviations from the number of animals in parentheses of each group. *, **, and ***: P < 0.05, P < 0.005, and P < 0.0001 compared with wild-type mice, respectively.

