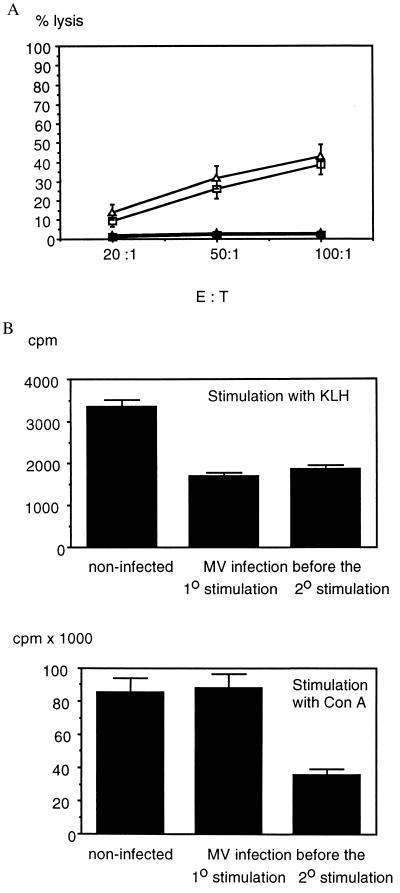
Figure 2.
Effect of MV infection on vaccinia virus-specific cytotoxic T cells and proliferation and cytokine secretion of KLH-specific T cells. (A) For primary stimulation, cotton rats were injected with 2 × 10⁶ pfu of vaccinia virus (MVA strain), and 3 weeks later their spleen cells were stimulated in vitro by cocultivation with mitomycin C-treated, MVA-infected mouse spleen cells. On day 5 after in vitro stimulation, per 1.5 × 10⁷ cells, 7.5 ± 0.3 × 10⁶ cells were recovered from the original culture from noninfected animals and 3.6 ± 0.2 × 10⁶ cells were recovered from animals infected with MV before the secondary stimulation (average of two and three animals per group ± SD). Pooled T cells from two noninfected (squares) and three MV-infected animals (triangles) were used at the same effector-to-target ratio on vaccinia virus-infected (open symbols) and noninfected (solid symbols) cotton rat macrophages (percent lysis ± SD). (B) For primary stimulation, cotton rats were injected with KLH, and 4 weeks later their spleen cells were stimulated in vitro with KLH (Upper) to test the antigen-specific T cell response (cpm ± SD). In addition, Con A-stimulated antigen-unspecific proliferation (Lower, in cpm ± SD) was tested as an indicator of immune suppression at the time of assay. Groups of noninfected animals or animals infected with MV before the primary or the secondary stimulation were tested. Data are the average of two animals per group and were similar in four experiments. The difference in suppression of KLH- and Con A-stimulated proliferation of spleen cells from animals infected with MV before the primary stimulation indicates a suppression of memory T cells.

