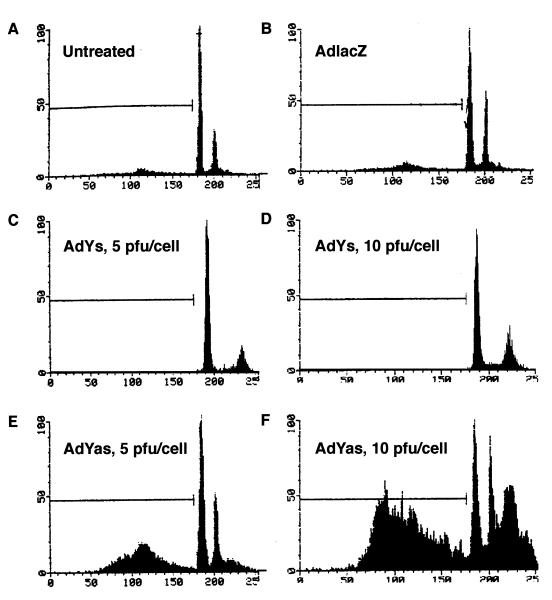
Figure 5.
Flow cytometric analysis of the Ad-Yas-infected ARO cells. The DNA content of ARO cells was analyzed by flow cytometry after propidium iodine staining. Cells either were treated with PBS (A) or infected with Ad-lacZ 10 pfu per cell (B), Ad-Ys (5 and 10 pfu per cell) (C and D, respectively), or Ad-Yas (5 and 10 pfu per cell) (E and F, respectively).

