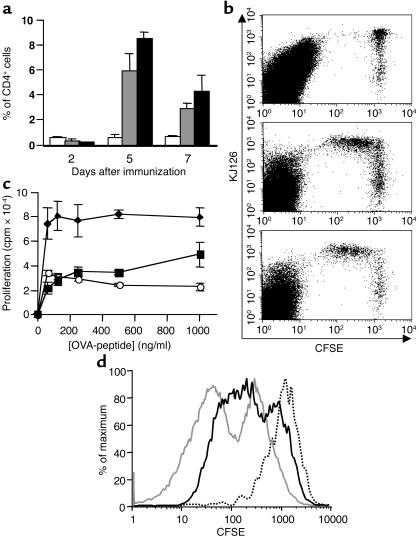
Figure 7.
KJ126+ DO11.10 T cells expand normally in vivo in LTβR-Ig–treated mice, but ex vivo recall responses are impaired. (a) DO11.10 T cell expansion in vivo at days 2, 5, and 7 after immunization is represented as percentage of CD4+ T cells that are KJ126+. DO11.10 T cells were transferred to control huIgG-treated (gray bars) or LTβR-Ig–treated (black bars) BALB/c recipients, and the mice were then immunized with OVA323–339 plus CFA (gray and black bars) or not immunized (white bars). (b) Proliferation of DO11.10 T cells was assessed in vivo by prelabeling KJ126+ CD4+ T cells with CFSE and transferring these cells to recipients that were not immunized (top panel) or immunized with OVA323–339 plus CFA and treated with huIgG (middle panel) or LTβR-Ig (bottom panel) as in a. A representative FACS plot 5 days after immunization is shown here, and in each experiment five immunized animals (both treatment groups) and three unimmunized animals were evaluated separately. (c) Proliferation of CD4+ T cells from control huIgG-treated mice (diamonds) was compared with that of LTβR-Ig–treated mice at day 7 (circles). CD4+ T cells from nonimmunized mice were used as controls (squares). These experiments were performed three times with similar results. (d) Proliferation of CD4+ KJ126+ T cells was assessed using CFSE labeling at day 7. CD4+ KJ126+ T cells from control huIgG-treated mice stimulated with OVA323–339 (gray line) were compared with that of LTβR-Ig–treated mice (black line) and unstimulated LN cells (dotted line). These data are representative of three separate mice.

