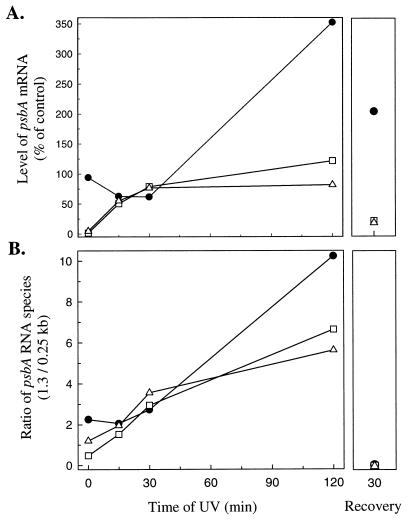
Figure 3.
Quantification of psbA transcripts under control, UV-B, and postexposure recovery treatments. (A) Levels of full-length 1.3-kb transcripts. psbAI, •; psbAII, □; psbAIII, ▵. Values plotted are the average of two independent replicates, expressed relative to the content at time zero. (B) Ratio of psbA mRNA species (1.3/0.25 kb). psbAI, •; psbAII, □; psbAIII, ▵. Values plotted are the average of two replicates.

