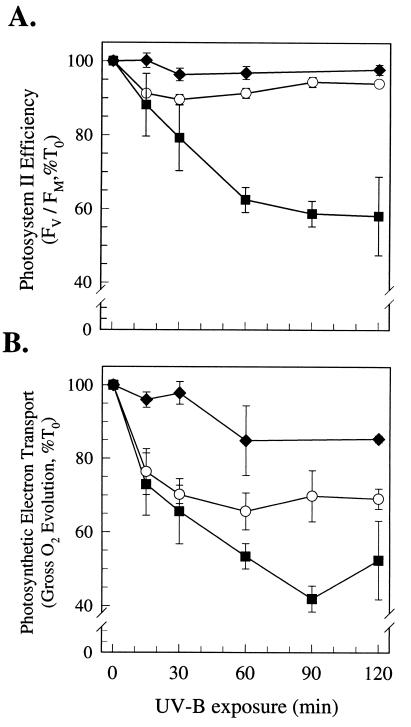
Figure 7.
Photosynthetic activity under moderate UV-B exposure. Wild-type cells (○), initially containing D1:1 but switching to D1:2 within 30 min, R2S2C3 mutant cells containing only D1:1 protein (▪), and R2K1 mutant cells containing only D1:2 protein (♦). (A) PSII function measured by using the Chl fluorescence parameter FV/FM. (B) Photosynthetic electron transport measured as gross oxygen evolution. Values are expressed as a percentage of the 0-h control (100%) and represent the mean ± SEM (n = 3).

